
Technical Resources
Peak Transmission vs Average Transmission in Optical Filters
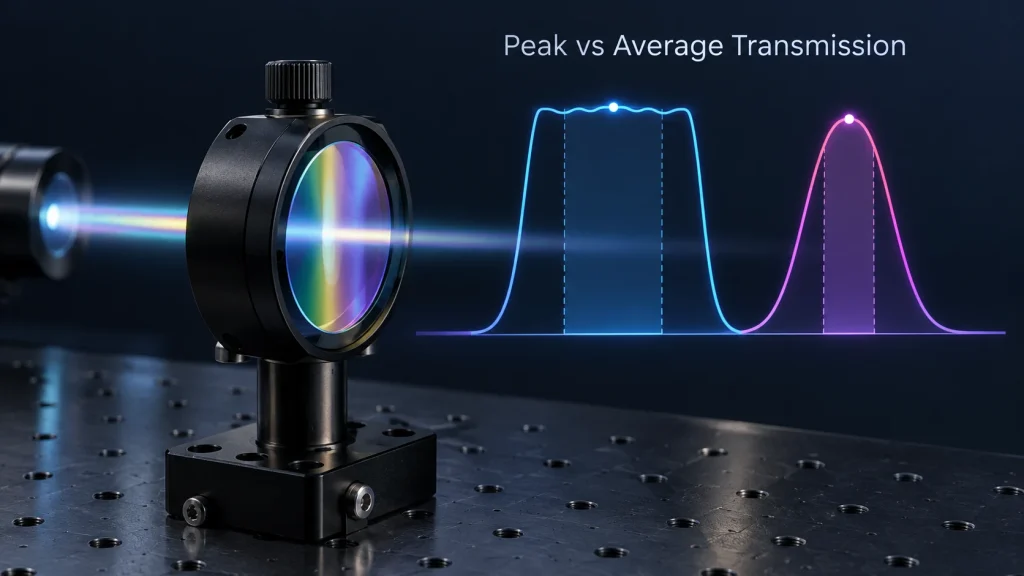
Peak transmission vs average transmission: peak transmission (Tpeak) is the single highest transmission value inside a filter’s passband. Average transmission (Tavg) is the mean transmission across a stated wavelength interval. Peak tells you the best point on the curve; average tells you how much light the band passes as a whole. Neither is meaningful until the wavelength interval, angle of incidence, polarization and measurement conditions are stated.
The two numbers are often quoted side by side on datasheets, and they are easy to misread. A filter specified at “Tpeak > 95%” can deliver far less signal than that number suggests if the passband is rounded or rippled, and an “average > 90%” requirement can hide a dip that sits exactly on a laser line. This guide explains how each value is defined, why they differ, which one controls system throughput, and how to write a transmission requirement that a supplier can actually build and test against.
Peak Transmission vs Average Transmission at a Glance
| Metric | What it measures | What it can hide | Typical use |
|---|---|---|---|
| Peak transmission (Tpeak, Tmax) | Highest transmission at any single wavelength in the passband | Passband shape, ripple, dips, and whether the peak coincides with the operating wavelength | Narrowband and laser-line filters, where the passband has no flat region |
| Average transmission (Tavg) | Mean transmission over a defined interval λ1–λ2 | Local minima and narrow dips inside the interval | Broadband passbands, longpass and shortpass filters, dichroics, AR-coated windows |
| Minimum transmission (Tmin, sometimes written Tabs) | Lowest transmission at any wavelength in the interval | How much of the band sits well above the floor | Laser lines with wavelength drift, multi-line sources, tight throughput budgets |
| Passband ripple | Peak-to-valley variation of transmission inside the band | Absolute throughput level | Spectral imaging, ratiometric measurement, colour-critical systems |
For any one passband interval, the three values always line up as Tmin ≤ Tavg ≤ Tpeak. The gap between them is a direct description of passband shape.
How Each Value Is Defined
Peak transmission
Peak transmission is the maximum value of the measured transmission curve T(λ) within the passband, usually expressed in percent. For a bandpass filter it normally occurs near the center wavelength (CWL), but not necessarily at it: in multi-cavity designs the highest ripple maximum can sit off-center, and in angle-tuned or temperature-shifted filters the peak moves relative to the source.
Because it is a single-point value, peak transmission is sensitive to anything that affects one point on the curve: spectrophotometer resolution, wavelength step size, noise, and beam geometry.
Average transmission
Average transmission is the mean of T(λ) over a specified wavelength interval. Unless a different weighting is agreed, it is the arithmetic mean of equally spaced data points, which approximates:
Tavg = [1 / (λ2 − λ1)] ∫λ1λ2 T(λ) dλThe interval is part of the specification. “Tavg > 90%” without λ1 and λ2 cannot be verified, and the same filter can return very different averages depending on whether the interval is the flat top of the band, the full FWHM, or a window around one operating wavelength.
The word “average” has a second meaning in coating specifications. At non-normal incidence, Tavg is also used for the polarization average, (Ts + Tp) / 2, which represents unpolarized light. A dichroic specified “Tavg > 90% at 45°” may therefore be averaged over polarization, over wavelength, or both. The specification should say which.
Minimum transmission and ripple
Minimum transmission is the lowest point of T(λ) in the interval. Ripple is the peak-to-valley variation of transmission inside the band, normally quoted in percentage points (a “±” ripple figure is half that peak-to-valley span). For a flat-top filter, peak and average are only meaningful together with one of these two numbers, because they define how deep the dips can be.
Why Peak and Average Transmission Differ
The difference between Tpeak and Tavg comes almost entirely from passband shape. Two common shapes behave very differently.
Flat-top (multi-cavity) passbands
Multi-cavity interference filters are designed to have a steep-edged, relatively flat passband. Their transmission oscillates slightly across the top of the band. If the averaging interval covers only the flat region, Tavg is typically close to Tpeak, separated by roughly half the ripple. The practical question is whether any ripple minimum falls on an important wavelength. See flat-top vs Gaussian bandpass filters for how passband shape is selected.
Rounded (Gaussian- or Lorentzian-like) passbands
Narrowband filters with few cavities have a rounded top. Here the average depends strongly on the interval. As a mathematical illustration, if the passband were an ideal Gaussian, the mean transmission across its own FWHM would be about 81% of the peak value; for an ideal Lorentzian line shape, about 79%. Real filter curves are neither exactly Gaussian nor exactly Lorentzian, but the conclusion holds: for a rounded passband, the average over the FWHM sits well below the peak.
| Passband shape (ideal) | Tpeak | Tavg across the FWHM | Ratio Tavg / Tpeak |
|---|---|---|---|
| Rectangular, no ripple | 90% | 90% | 1.00 |
| Flat top with 4-point peak-to-valley ripple (e.g. 88–92%) | 92% | ≈ 90% | ≈ 0.98 |
| Gaussian | 90% | ≈ 73% | ≈ 0.81 |
| Lorentzian | 90% | ≈ 71% | ≈ 0.79 |
This is why peak transmission is the usual headline value for narrowband and laser-line filters, while average transmission is the usual headline value for broadband passbands, edge filters and AR coatings. Each is the metric that is stable for that shape.
Which Transmission Value Matters for Your System?
What reaches the detector is not set by a filter metric alone. It is set by the overlap of the source spectrum S(λ), the filter transmission T(λ) and the detector responsivity R(λ):
Signal ∝ ∫ S(λ) · T(λ) · R(λ) dλPeak and average transmission are shortcuts to this integral. Which shortcut is closer depends on the source.
| Source / application | Most relevant metric | Why |
|---|---|---|
| Narrow-linewidth laser at a fixed wavelength | T at the laser wavelength, or Tmin over the laser’s wavelength tolerance and drift window | The laser samples only a small part of the curve; the peak may not be where the laser is |
| Laser that drifts with temperature (e.g. uncooled diode lasers) | Tmin across the full drift range at the operating AOI and temperature | A high peak is worthless if the line walks onto the passband slope |
| LED, lamp or other broadband source | Tavg over the useful emission band, ideally weighted by S(λ)·R(λ) | Throughput is an integral over many wavelengths |
| Fluorescence emission | Tavg over the emission window, together with blocking at the excitation wavelength | Emission spectra are broad; signal scales with band area, not peak height |
| Spectral imaging or ratiometric measurement | Tavg plus a ripple limit | Ripple adds wavelength-dependent errors to the measured ratio |
Laser wavelength drift, tolerance and linewidth should be taken from the laser datasheet. The window over which Tmin is specified must include CWL tolerance, temperature drift and any AOI-induced shift of the filter itself.
Conditions That Change Both Numbers
- Angle of incidence (AOI). Tilting an interference filter shifts its passband toward shorter wavelengths. The peak value may hold at small angles, but transmission at a fixed laser wavelength can drop sharply. Converging beams spread the AOI across a cone, which broadens the passband and lowers its peak; see cone half-angle effects on interference filters.
- Polarization. At oblique incidence, s- and p-polarized light see different passband positions and widths, so Ts, Tp and their average can all differ. See how polarization affects filter spectra at oblique incidence.
- Temperature. Interference passbands shift with temperature. The size of the shift depends on coating materials and process, so it should be stated for the specific filter rather than assumed.
- Substrate and back-surface losses. An uncoated glass surface with n ≈ 1.52 reflects about 4.3% at normal incidence, and absorbing substrates or coating materials reduce transmission further. Whether the back surface is AR coated directly limits achievable peak and average values. Material effects are covered in how material absorption affects optical transmission.
- Position on the part. Coating thickness can vary across the clear aperture, shifting the passband slightly from center to edge. A curve measured at one spot describes that spot.
Measurement Pitfalls When Verifying Peak and Average Transmission
Instrument bandwidth
A spectrophotometer measures the filter curve convolved with its own spectral bandwidth (slit function). For broad passbands this has little effect except near the edges. For narrowband filters it can lower the measured peak and widen the measured FWHM. As an illustration, if a Gaussian passband is measured with a Gaussian instrument function of the same FWHM, the recorded curve is √2 times wider and its peak falls to about 71% of the true value. The instrument’s spectral bandwidth should therefore be several times narrower than the filter FWHM, and it should be recorded with the data.
Averages over a wide interval are much less sensitive to instrument bandwidth, because convolution redistributes transmission rather than removing it. That advantage disappears when the averaging window is comparable to the instrument bandwidth or includes steep edges.
Beam geometry
A focused or poorly collimated measurement beam introduces its own cone of angles and can reduce the measured peak of a narrowband filter. Test geometry should match the specified AOI and, where relevant, the system’s cone angle.
Data step, averaging method and baseline
- A coarse wavelength step can miss the true peak or a narrow ripple minimum.
- The averaging method (equal-step arithmetic mean, or weighted) and the exact interval endpoints should be fixed in the specification.
- Baseline accuracy, stray light and sample alignment limit the absolute accuracy of any percentage value. Small differences between two suppliers’ reported values may be within measurement uncertainty.
- Where witness samples are used for spectral testing, the relationship between witness and part should be agreed, because substrate and position can differ.
For a broader view of how spectral limits and test conditions are written, see optical filter spectral tolerance explained.
How to Specify Transmission on a Filter Drawing
A useful transmission requirement contains the metric, the wavelength interval, the limit and the conditions. The following lines show the structure; the numbers are placeholders, not GIAI product data.
Broadband passband: Tavg ≥ [X]% from [λ1] to [λ2] nm; Tmin ≥ [Y]% over the same range; AOI 0°, collimated, unpolarized; equal-step arithmetic average. Laser-line filter: T ≥ [Y]% from [λlaser − Δ] to [λlaser + Δ] nm, where Δ covers laser tolerance, temperature drift and AOI tolerance; Tpeak reference only. 45° dichroic: Tavg ≥ [X]% from [λ1] to [λ2] nm, averaged over wavelength and over s/p polarization; state separately if Ts and Tp must each meet a limit.| Weak specification | Problem | Stronger alternative |
|---|---|---|
| “Transmission > 90%” | No metric, interval or conditions; cannot be tested consistently | State Tavg, Tmin or Tpeak with λ1–λ2, AOI and polarization |
| Tpeak only, for a laser system | The laser may sit on the passband slope after drift or tilt | Tmin across the laser’s full wavelength window at operating AOI |
| Tavg across the full FWHM of a narrowband filter | Edges pull the average down; the limit becomes design-driven, not performance-driven | Tpeak plus FWHM, or Tmin over the narrower interval that the system actually uses |
| Tavg only, for spectral imaging | Allows ripple that distorts ratios | Tavg plus a peak-to-valley ripple limit |
| Very high Tpeak combined with very narrow FWHM, deep blocking and wide AOI tolerance | Requirements trade against each other in the coating design, raising cost or making the design impractical | Rank requirements by system impact and discuss trade-offs with the supplier |
Over-specifying transmission is a real cost driver. Raising the required peak or average value often means more layers, tighter process control or AR coating on the back surface, and it can conflict with blocking depth or edge steepness. A requirement derived from the system’s signal budget is usually more useful than the highest number a datasheet has ever shown.
FAQ
Is average transmission always lower than peak transmission?
Over the same passband, average transmission cannot exceed peak transmission, because the mean of a set of values cannot be higher than its maximum. They are equal only for a perfectly flat passband. For flat-top filters averaged over the flat region the gap is small; for rounded narrowband passbands averaged across the FWHM it is much larger.
Why do narrowband filter datasheets usually list only peak transmission?
A narrowband passband has little or no flat region, so an average depends heavily on the chosen interval and is easily misinterpreted. Peak transmission together with CWL and FWHM describes the shape more consistently. For laser systems, transmission at the actual laser wavelength range is still the value to confirm.
Does “Tavg” mean averaged over wavelength or polarization?
It can mean either. In bandpass and edge filter specifications it usually refers to a wavelength average. At oblique incidence, especially for dichroics and beamsplitters, it often also means the average of s- and p-polarized transmission. The specification should state both the wavelength interval and the polarization condition.
Can two suppliers report different peak transmission for the same filter?
Yes. Differences in spectrophotometer bandwidth, wavelength step, beam collimation, AOI, measurement spot and baseline correction can change the reported peak, particularly for filters with narrow FWHM. Agreeing on the test method before comparing numbers avoids most disputes.
Which value should I use to estimate signal level?
Use the full curve if possible: multiply source spectrum, filter transmission and detector responsivity, then integrate. When only datasheet values are available, use transmission at the laser wavelength for laser sources and average transmission over the emission band for broadband sources.
Discussing a Custom Filter Transmission Specification
GIAI Photonics supports custom optical filter and optical coating projects and reviews each one against the drawing, optical requirements, substrate, geometry, coating conditions and inspection criteria before defining the manufacturing route. Spectral verification is carried out according to the agreed part specification and measurement conditions, as described in our quality assurance process.
For a technical review, send the drawing or sample together with the source type and wavelength (including tolerance and drift), the transmission metric and interval you need, blocking range and OD, AOI and cone angle, polarization, operating temperature, substrate, dimensions, clear aperture, test conditions and expected quantity through the contact page.
Further reading: Photonics Handbook – Filters glossary, equations and parameters; GIAI Filters & Coatings resources.