
Technical Resources
How to Match Fluorescence Filters to Fluorophore Spectra
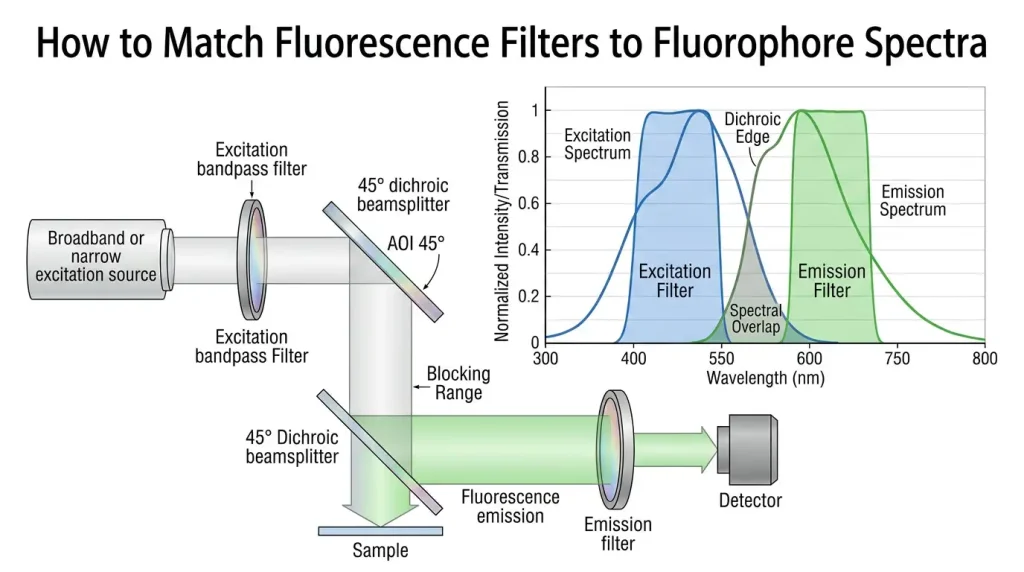
To match fluorescence filters to fluorophore spectra, do not select filters from excitation and emission peak wavelengths alone. Overlay the complete fluorophore excitation and emission curves with the excitation filter, dichroic and emission filter spectra, then evaluate how much useful spectral overlap is retained and how effectively excitation light, background and neighboring fluorescence channels are rejected.
The practical objective is not simply to place one filter at the excitation maximum and another at the emission maximum. A fluorescence system has to deliver enough excitation power to the fluorophore, collect enough emitted photons at the detector and prevent the much stronger illumination from entering the detection path.
That makes fluorescence filter matching a system-level spectral problem involving the fluorophore, light source, three filter functions, detector response, angle of incidence and optical geometry.
The Three Spectral Functions in a Fluorescence Filter Set
A typical epi-fluorescence optical path contains three wavelength-selective functions:
- Excitation filter: selects the illumination wavelengths used to excite the fluorophore.
- Dichroic beamsplitter: separates the excitation and fluorescence paths by reflection and transmission.
- Emission filter: passes the useful fluorescence signal while suppressing excitation leakage and unwanted spectral background.
A simplified optical path is:
These components should be evaluated together. A good excitation filter cannot compensate for an emission filter that admits scattered excitation light, and a high-transmission emission filter does not help if the dichroic removes a substantial part of the useful fluorescence band.
Start with the Full Fluorophore Spectra, Not Only Ex and Em Peaks
Fluorophore datasheets commonly list an excitation maximum and an emission maximum. These numbers are useful identifiers, but they are not sufficient for filter selection.
An excitation spectrum describes the relative efficiency with which different wavelengths can excite the fluorophore. The excitation maximum is simply the most efficient wavelength under the stated measurement conditions. Wavelengths on either side can still produce fluorescence, although usually with lower efficiency.
The emission spectrum is similarly distributed across a wavelength range rather than concentrated at one wavelength. A detector can therefore collect useful fluorescence away from the emission maximum.
What matters to the optical system is the spectral overlap.
For the excitation path, useful excitation is related to the overlap between:
- source spectral output;
- excitation-filter transmission;
- fluorophore excitation spectrum.
For detection, collected signal depends on the overlap between:
- fluorophore emission spectrum;
- dichroic transmission;
- emission-filter transmission;
- detector spectral sensitivity or quantum efficiency.
This is why two filters with apparently suitable center wavelengths can deliver different system performance.
How to Match Fluorescence Filters to Fluorophore Spectra Step by Step
1. Obtain the Relevant Excitation and Emission Curves
Use spectral data for the actual fluorophore or fluorescent conjugate whenever possible. Do not assume that a generic peak wavelength represents every sample condition.
Fluorescence properties can be influenced by factors such as molecular environment, pH, solvent, binding state and conjugation. For applications with narrow spectral margins, a shift of only a few nanometers can affect filter-edge placement.
If measured spectra are available from the intended assay or optical system, they are generally more useful than a nominal color name or peak-wavelength table.
2. Match the Excitation Filter to a Useful Excitation Region
The excitation filter should transmit a portion of the spectrum where both the source and fluorophore provide useful optical efficiency.
It does not always need to be centered exactly on the excitation maximum.
For a broadband LED or lamp, a wider excitation band can deliver more optical power, but widening the band toward the emission region reduces spectral separation. In a small-Stokes-shift system, moving the excitation band slightly toward shorter wavelengths can sometimes create more room for the dichroic transition and emission filter.
For laser excitation, the design problem is different. The source already occupies a narrow wavelength range, so the excitation filter may primarily suppress unwanted laser output, sidebands or broadband background rather than define a wide illumination band.
3. Leave a Real Transition Region Between Excitation and Emission
The wavelength difference between the excitation and emission maxima is commonly called the Stokes shift. A larger Stokes shift generally gives the filter designer more spectral separation, while a smaller shift requires steeper transitions and more careful blocking.
However, the peak-to-peak Stokes shift should not be treated as an empty wavelength gap. Excitation and emission spectra usually have finite widths and can overlap significantly.
The system must accommodate:
- the long-wavelength transition of the excitation filter;
- the reflection-to-transmission transition of the dichroic;
- the short-wavelength transition of the emission filter;
- manufacturing tolerances;
- AOI-dependent spectral shifts.
When these regions become crowded together, maximizing every passband is rarely possible. Some excitation efficiency or collected emission may need to be sacrificed to achieve adequate rejection.
4. Place the Dichroic Transition Between the Useful Bands
In a common fluorescence configuration, the dichroic reflects the excitation band and transmits the longer-wavelength fluorescence. The transition edge should therefore sit between the useful excitation and detection regions without unnecessarily cutting into either one.
The dichroic must be evaluated at its actual operating angle. Many fluorescence beamsplitters operate around 45° AOI, where interference-coating behavior differs significantly from normal incidence.
At oblique incidence, s- and p-polarized light can also experience different spectral responses. This becomes especially important near a steep transition or when polarized laser excitation is used.
Consequently, a 0° transmission curve should never be assumed to describe a dichroic operating at 45°.
5. Match the Emission Filter to Useful Signal, Not Merely the Emission Maximum
The emission filter determines which portion of the fluorescence spectrum reaches the detector.
A wider emission band collects more fluorescence photons, but it can also admit more:
- sample autofluorescence;
- ambient or stray light;
- neighboring fluorescence channels;
- residual excitation leakage.
A narrower bandpass can improve spectral isolation but reduces collected signal.
The correct width therefore depends on whether the system is limited primarily by photon collection or by background and crosstalk.
Bandpass or Longpass Emission Filter?
| Emission Filter | Primary Advantage | Main Limitation | Typical Use |
|---|---|---|---|
| Bandpass | Controls both short- and long-wavelength detection limits | Rejects part of the available fluorescence spectrum | Multiplexing, high background, controlled detection channels |
| Longpass | Collects a larger part of the long-wavelength emission tail | Also admits longer-wavelength background and other emitters | Single-channel systems where maximum photon collection is important |
Neither option is inherently better. The decision should be made from the complete emission spectrum and background environment.
Optical Density Must Be Specified with a Wavelength Range
Fluorescence signals can be much weaker than the excitation illumination, so out-of-band blocking is often as important as passband transmission.
Optical density is related to transmission by:
OD = -log10(T)
where T is fractional transmission.
| Optical Density | Transmission |
|---|---|
| OD 2 | 1% |
| OD 3 | 0.1% |
| OD 4 | 0.01% |
| OD 5 | 0.001% |
| OD 6 | 0.0001% |
The higher number represents lower transmitted leakage, but a statement such as “OD 6 filter” is incomplete without specifying where that blocking applies.
The required blocking range should be determined from the source spectrum, excitation wavelength, detector sensitivity and unwanted optical paths. Deeper OD is not automatically useful if it occurs outside wavelengths that can reach or affect the detector.
Peak Transmission Is Not the Same as Useful Transmission
A filter may advertise a high peak transmission while transmitting less efficiently across much of the fluorophore spectrum.
For fluorescence systems, average or integrated transmission across the useful spectral region can be more informative than the highest transmission value at one wavelength.
For example, an emission filter with a very high transmission peak but a narrow passband may collect fewer total fluorescence photons than a somewhat lower-transmission filter covering more of the emission spectrum.
The same distinction applies to excitation filters: excitation efficiency depends on the overlap between source power, filter transmission and fluorophore response rather than one isolated transmission number.
AOI and Cone Angle Can Change the Match
Interference filters are angle-sensitive. Increasing the angle of incidence generally moves their spectral features toward shorter wavelengths.
This matters for more than intentionally tilted filters. A converging or diverging beam contains a range of incidence angles, so different rays can experience slightly different spectral responses. The effective passband or transition can become shifted or broadened compared with a measurement made using a collimated beam at one nominal AOI.
When specifying fluorescence filters, engineers should therefore define:
- nominal AOI;
- AOI tolerance or range;
- beam cone angle;
- collimated, converging or diverging geometry;
- polarization state where relevant.
Matching Filters in Multicolor Fluorescence Systems
Multichannel fluorescence requires more than optimizing each fluorophore independently.
One fluorophore’s emission may enter another channel’s detector. A second fluorophore may also absorb part of the first channel’s excitation band. These effects are commonly described as bleed-through, spectral crosstalk or cross-excitation.
For each channel, overlay all relevant excitation and emission spectra simultaneously and check:
- whether one excitation band significantly excites another fluorophore;
- whether one emission spectrum enters another detection band;
- whether dichroic transitions remove useful signal;
- whether detector sensitivity increases unwanted channel response;
- whether sequential excitation would reduce interference.
A wide emission filter that works well in a single-color instrument may therefore be unsuitable in a multiplexed system.
A Practical Fluorescence Filter Specification Checklist
| System Input | What to Define |
|---|---|
| Fluorophore | Full excitation and emission spectra under relevant conditions |
| Light source | Laser wavelength or broadband source spectrum and output |
| Excitation filter | Passband, FWHM, transmission, blocking range and OD |
| Dichroic | Reflection band, transmission band, transition edge, AOI and polarization |
| Emission filter | Passband or cut-on wavelength, transmission and excitation blocking |
| Detector | Spectral sensitivity or quantum-efficiency range |
| Optical geometry | AOI, cone angle, clear aperture and beam configuration |
| Multichannel system | Cross-excitation, emission bleed-through and neighboring filter bands |
Common Mistakes When Matching Fluorescence Filters
Choosing Filters Only from Peak Wavelengths
Peak values do not describe the width or shape of the fluorescence spectrum. Always evaluate the complete curves.
Maximizing Passband Width Without Checking Background
Wider filters usually collect more signal, but they can also collect unwanted fluorescence and stray light. Signal and background must be evaluated together.
Specifying OD Without a Blocking Range
Optical density describes attenuation at a wavelength or wavelength interval. It does not define where the filter provides that attenuation.
Ignoring the Detector Spectrum
A wavelength transmitted by the filter contributes little if detector sensitivity there is low. Conversely, a detector that remains sensitive far outside the target fluorescence band may require wider blocking than expected.
Ignoring AOI
Interference-filter spectra depend on incidence angle. This is particularly important for dichroics and for filters located in non-collimated beams.
Optimizing Each Fluorescence Channel Independently
In multicolor systems, filter choices must be evaluated together. Improving photon collection in one channel can increase crosstalk in another.
Conclusion
How to match fluorescence filters to fluorophore spectra ultimately comes down to spectral overlap and rejection, not to matching three nominal wavelength numbers.
Start with the full excitation and emission curves. Match the excitation filter to a useful region of the excitation spectrum and the available source. Position the dichroic transition between the useful excitation and emission bands at the actual operating AOI. Then select an emission passband that captures enough fluorescence while suppressing excitation leakage, background and neighboring channels.
Finally, evaluate optical density over defined wavelength ranges, detector response, polarization and beam-angle distribution. When these factors are considered together, filter specifications represent the real optical system rather than an idealized spectral diagram.
Frequently Asked Questions
Should the excitation filter be centered exactly on the fluorophore excitation maximum?
No. The excitation maximum identifies the wavelength of highest excitation efficiency, but the fluorophore can normally be excited across a broader spectral range. The useful filter position depends on the source spectrum, Stokes shift, filter transition widths and unwanted background. In a tightly spaced fluorescence system, moving the excitation band slightly away from the maximum may reduce excitation-emission overlap and improve spectral separation, although some excitation efficiency is sacrificed. The full excitation curve should therefore be evaluated instead of automatically setting the filter CWL equal to the excitation maximum.
Should an emission filter be centered on the fluorescence emission peak?
Not necessarily. The objective is to collect a useful portion of the emission spectrum while excluding excitation leakage and other unwanted wavelengths. Centering a bandpass directly on the emission maximum may be appropriate when spectral separation is generous, but it can place the short-wavelength edge too close to the excitation region when the Stokes shift is small. Detector response, background fluorescence and neighboring channels also influence the optimum passband. Integrated useful signal is more meaningful than simply aligning two peak wavelengths.
How much optical density is needed for fluorescence filters?
There is no universal OD requirement for every fluorescence system. The required attenuation depends on excitation intensity, scattered light, detector sensitivity, sample fluorescence strength and the wavelength range over which unwanted light must be rejected. Because OD is logarithmic, increasing from OD4 to OD6 reduces transmitted leakage by a factor of 100, but that improvement only matters where the blocking range overlaps light capable of reaching the detector. Specify both the required OD and the exact wavelength interval rather than requesting a high OD value alone.
Why does angle of incidence matter when matching fluorescence filters?
Interference-filter spectral characteristics change with incidence angle. Increasing AOI generally shifts spectral features toward shorter wavelengths, and oblique incidence can also introduce differences between s and p polarization. A beam containing multiple angles can broaden the effective transition or passband. This is particularly important for dichroic beamsplitters operating near 45° and for filters positioned in converging or diverging beams. Filter curves should therefore be evaluated under the actual AOI, angular range and polarization conditions of the optical system.
How should filters be selected for multiple fluorophores?
Evaluate all excitation and emission spectra together rather than designing each channel independently. Check whether an excitation band also excites another fluorophore and whether one fluorophore’s emission enters another detector channel. Then compare those spectra with every excitation filter, dichroic transition and emission passband in the system. Narrower emission bands, different excitation wavelengths or sequential excitation can reduce crosstalk, but usually at the cost of photon collection or acquisition speed. The optimum arrangement depends on the complete spectral architecture of the instrument.